
How to Read a Token Page - Part 4 of Crypto 101 with Fere AI
A token page is basically a report card.
This report card tells you everything about a token from token’s health to traction and demand.
But, nobody teaches you how to read it.
You open a token on any platform and suddenly there are charts, bars, percentages, green numbers, red numbers, and metrics that sound like they belong in a math class.
The good news is that you don’t need to learn this the traditional way.
You can just ask Fere Pro to break down every metric for you in plain English.
One prompt at a time.
Price and Chart Movements
Price is the simplest number on the page but also the most misleading.
Price alone tells nothing if oyu do not understand movement.
You can see different trends short term, medium term and long term when you switch between 24 hours, 7 days or 30 days. A healthy token has a strong story behind its movement.
Ask Fere Pro:
“Summarize the $SOL (Solana) chart in one sentence”
You can then ask it to explain all the terms mentioned so it makes sense.
Fere AI will tell you exactly what the chart means without you having to interpret the candles yourself.
Market Cap
This is the real indicator. If you do not understand the supply, pricing means nothing.
Market cap equals circulating supply multiplied by price.
It shows the actual value the market is assigning to this token.
For example:
A token priced at 1 dollar with 10 billion supply is not the same as a token priced at 1 dollar with 10 million supply.
Ask Fere AI: “Show me tokens with a similar market cap to this one”
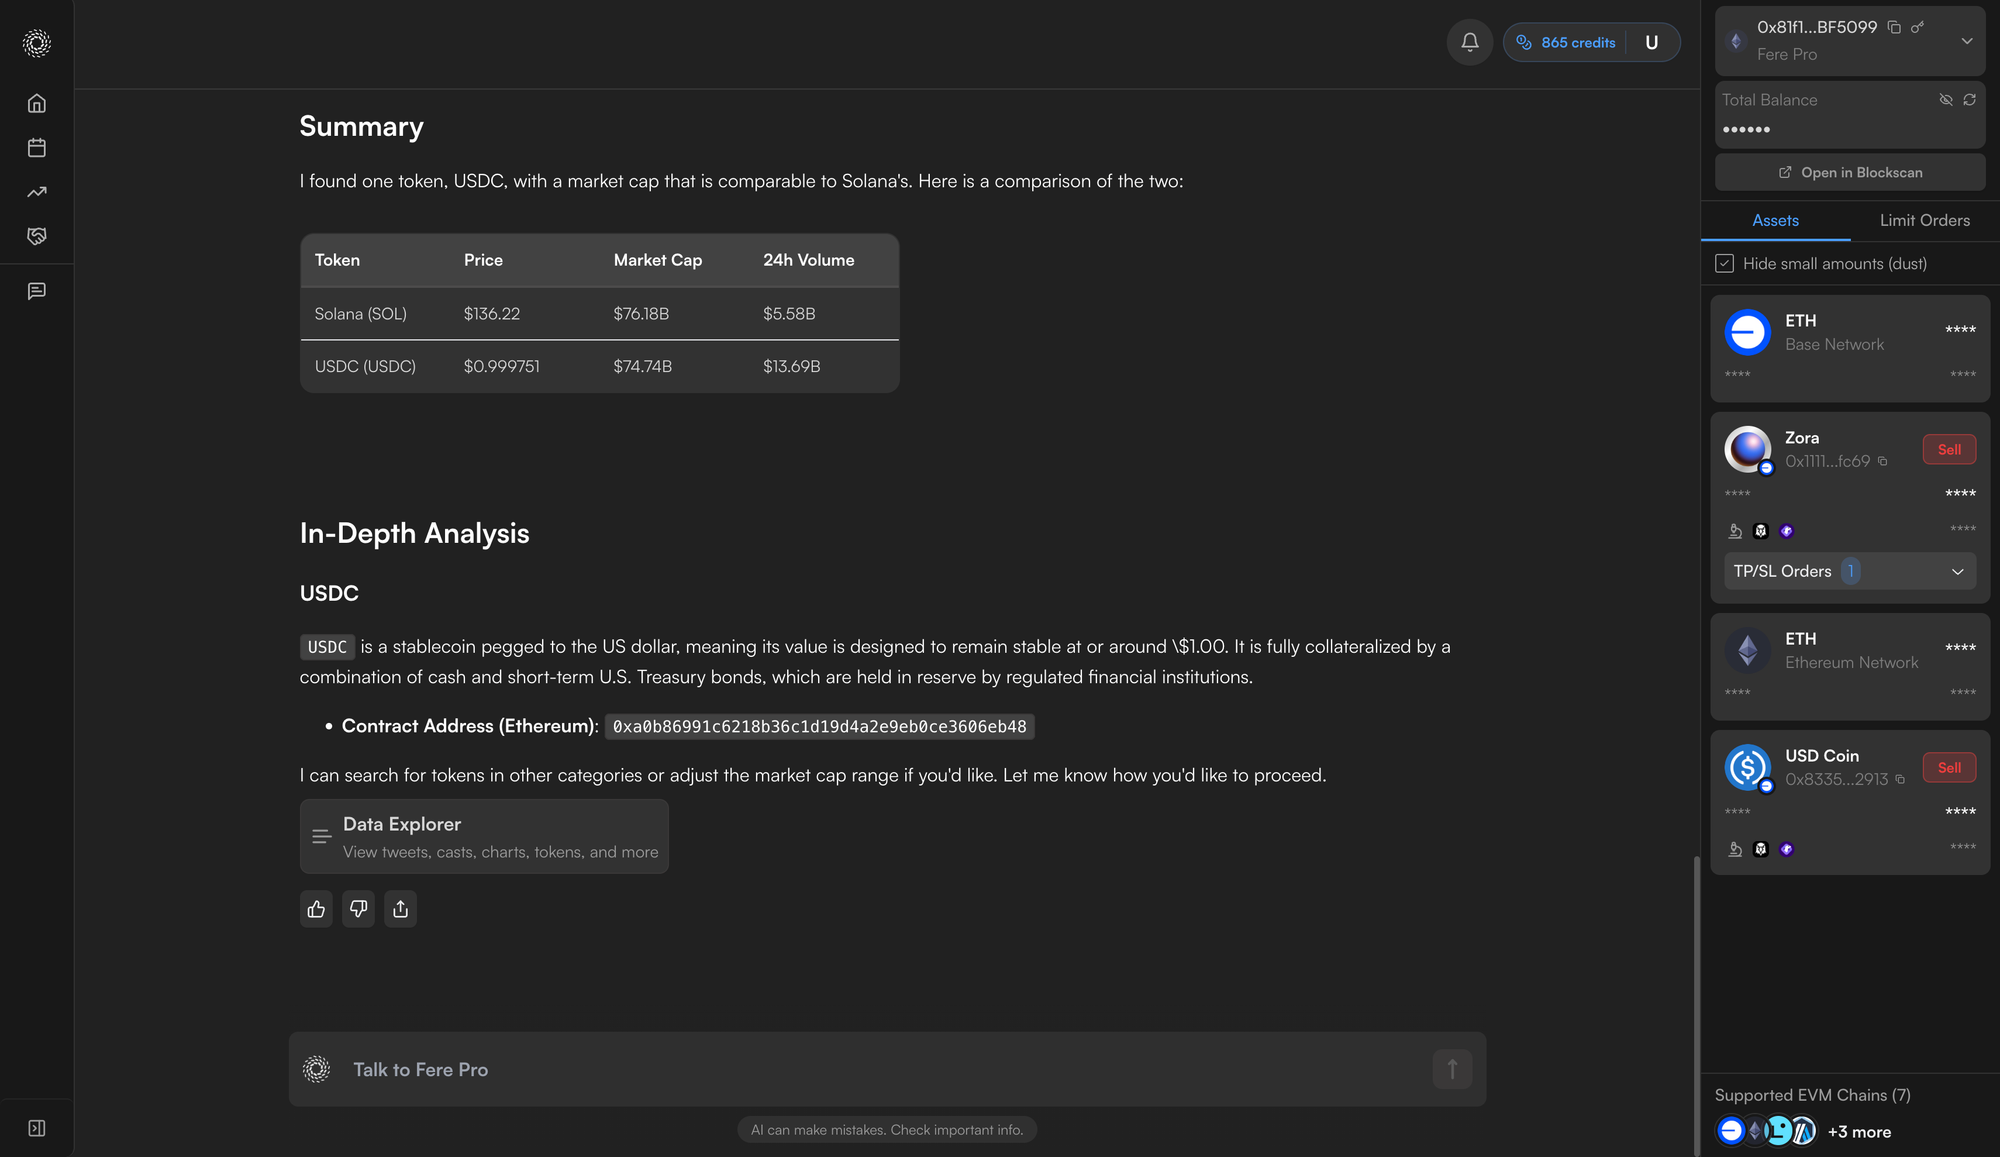
This helps you compare fairly instead of guessing by price.
Volume and Liquidity
Volume is a measure of how much money is flowing through this token.
Liquidity shows how much money is available to trade without affecting the price too much.
High volume shows interest and high liquidity means safer trades with less slippage.
Low liquidity means bad fills and unstable pricing.
Ask Fere Pro:
“Explain liquidity like I am 12”
You’ll get the simplest version possible without losing the meaning.
Holders and Distribution
Holder count shows traction. More holders means the community is strong and more active.
Distribution shows how concentrated the ownership is. If only a few wallets hold most of the supply, then that’s risky. A single whale is capable of moving the entire market.
Ask Fere AI:
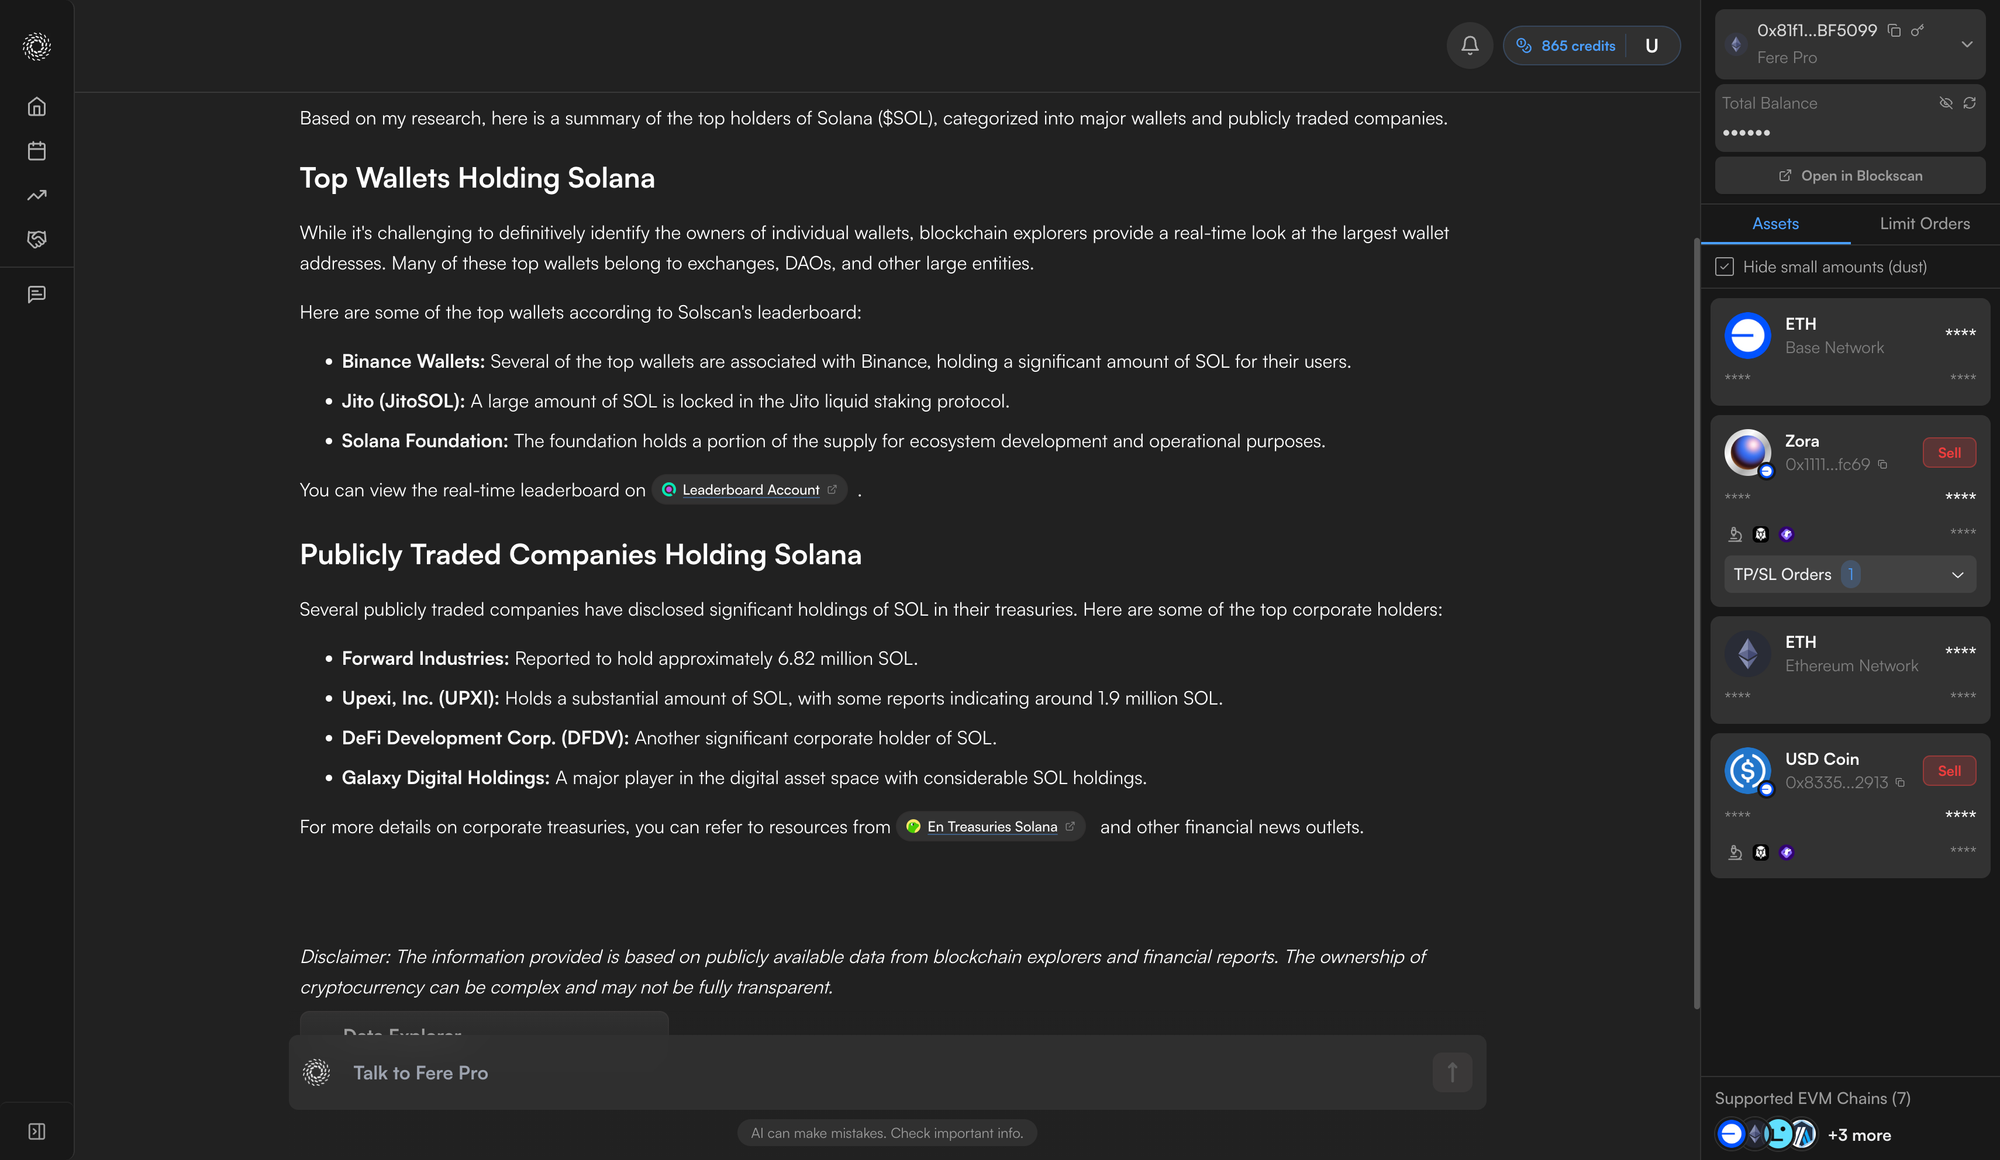
“Show me the top holders for Solana ($SOL)”
It will show wallet distribution and whether it looks healthy or risky.
Conclusion
Before you invest in a token, it’s is important to understand the story its numbers are telling.
Don’t just trade, understand it first.
DYOR with Fere Pro.
Try it for yourself today ↓